Phase II
Phase II Endpoint and Model Review — NTX-101
Week 24 efficacy, responder analysis, and benchmarked predictive modeling for NTX-101 proof-of-concept evaluation.
Gate Decision: GO
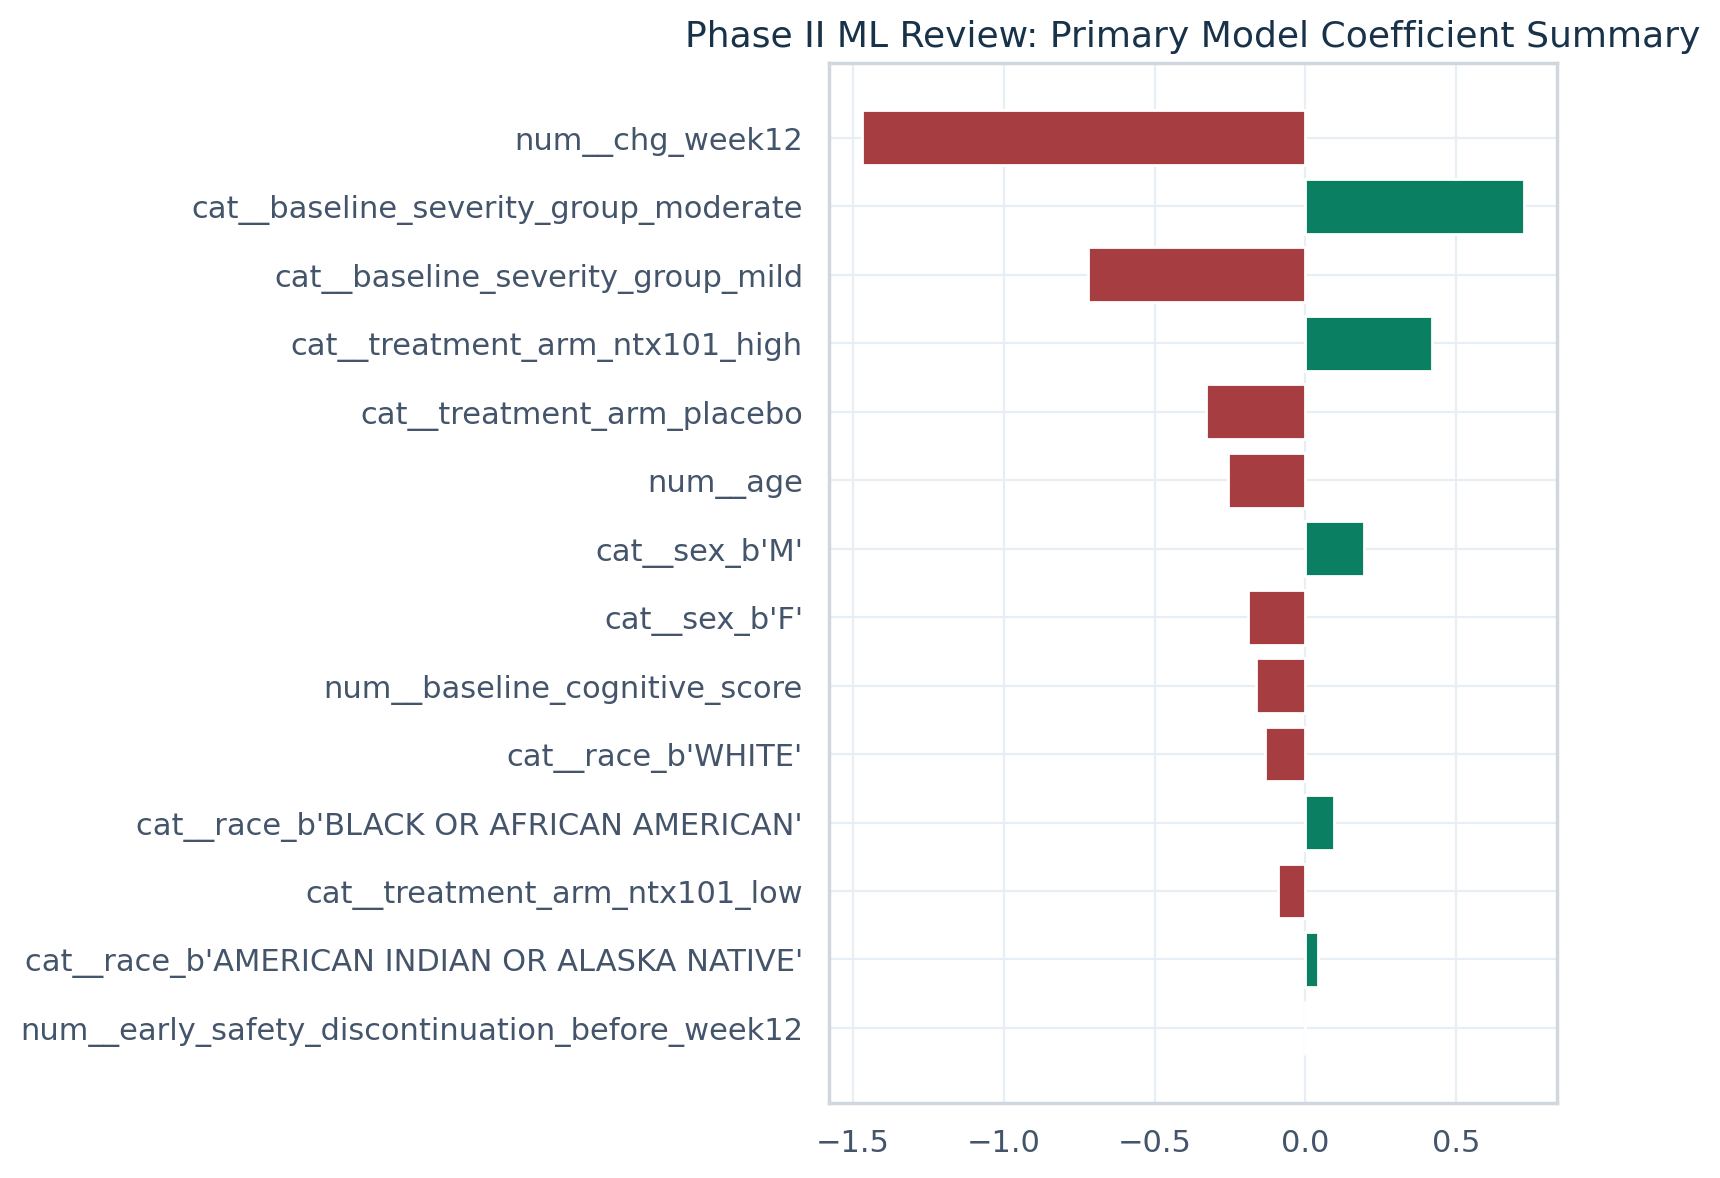
Primary model metrics
| Metric | Value |
|---|
| Threshold | 0.494 |
|---|
| ROC AUC | 0.867 |
|---|
| PR AUC | 0.845 |
|---|
| Brier | 0.145 |
|---|
| Sensitivity | 0.806 |
|---|
| Specificity | 0.75 |
|---|
| PPV | 0.758 |
|---|
| NPV | 0.8 |
|---|
| F1 | 0.781 |
|---|
| N (test) | 63 |
|---|
| Responder diff (pp) | 19.073 |
|---|
| Gate decision | GO |
|---|
| Primary model | logistic_regression |
|---|
| Primary endpoint p-value | 0.0019 |
|---|
| Threshold rationale | Training ROC threshold maximizing specificity with sensitivity ≥ 0.78 |
|---|
Responder rates by arm
| Treatment | Responder rate (%) |
|---|
| ntx101_high | 57.534 |
| ntx101_low | 50.725 |
| placebo | 38.462 |
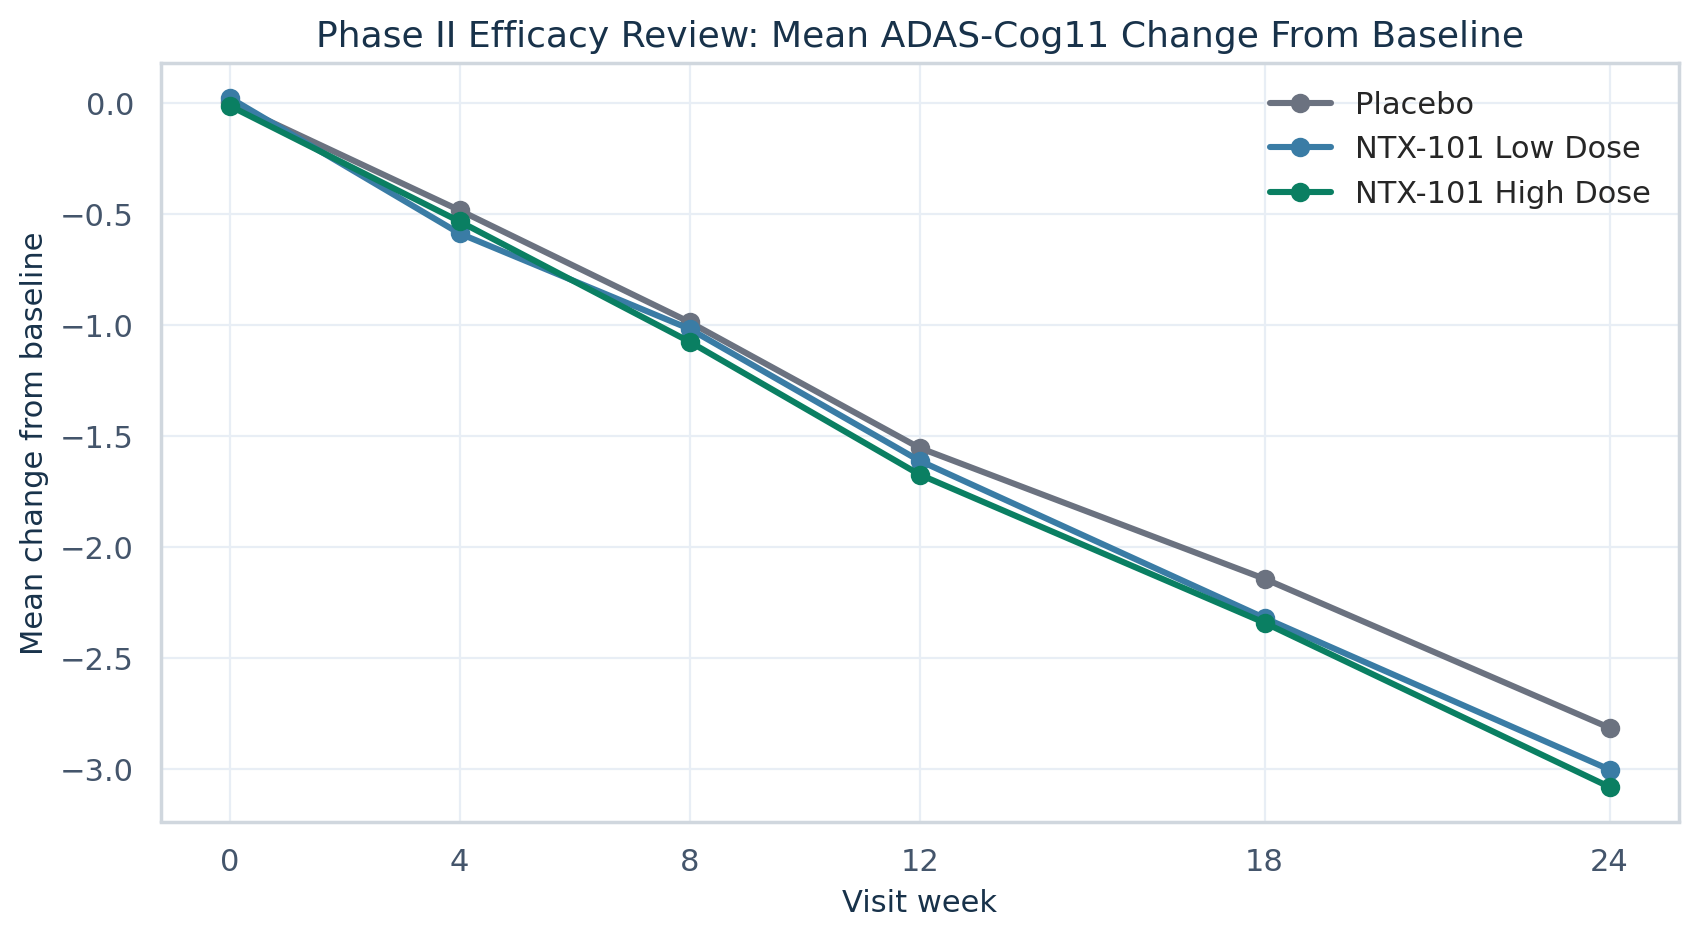
Hypothesis testing summary
| Comparison | Mean difference | t-statistic | p-value | Approx CI |
|---|
| ntx101_low vs placebo |
-0.188 |
-2.142 |
0.034 |
[-0.313, -0.064] |
| ntx101_high vs placebo |
-0.266 |
-3.526 |
0.0006 |
[-0.355, -0.178] |
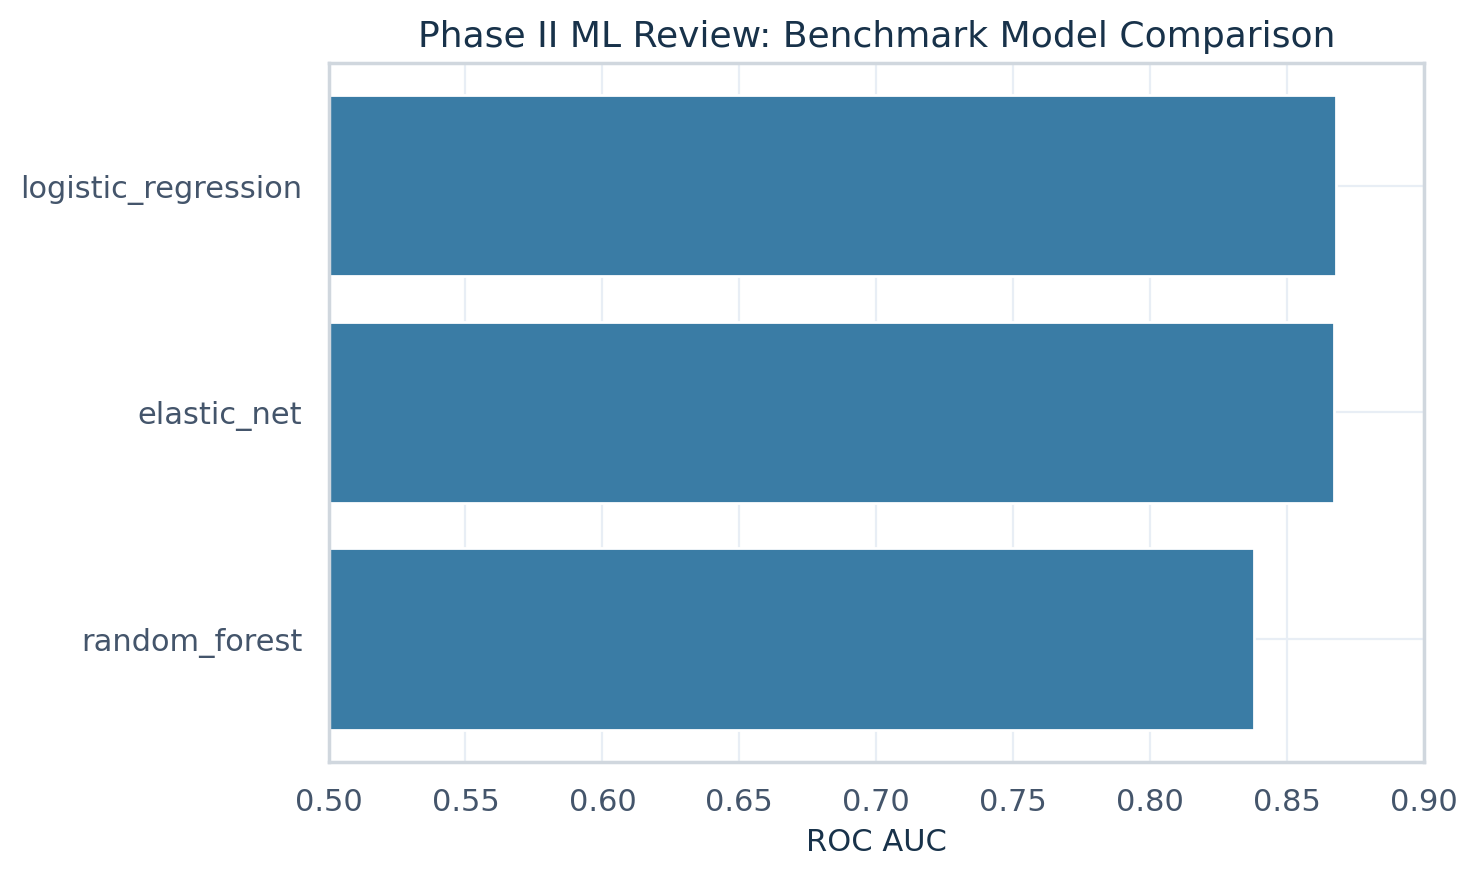
Benchmark models
| Model | ROC AUC | PR AUC | Brier | F1 |
|---|
| logistic_regression |
0.868 |
0.845 |
0.145 |
0.781 |
| elastic_net |
0.867 |
0.845 |
0.146 |
0.794 |
| random_forest |
0.838 |
0.849 |
0.173 |
0.75 |
Figures
![]()